

01
One-cell pilot
A handful of machines connected, states agreed and reasons captured.


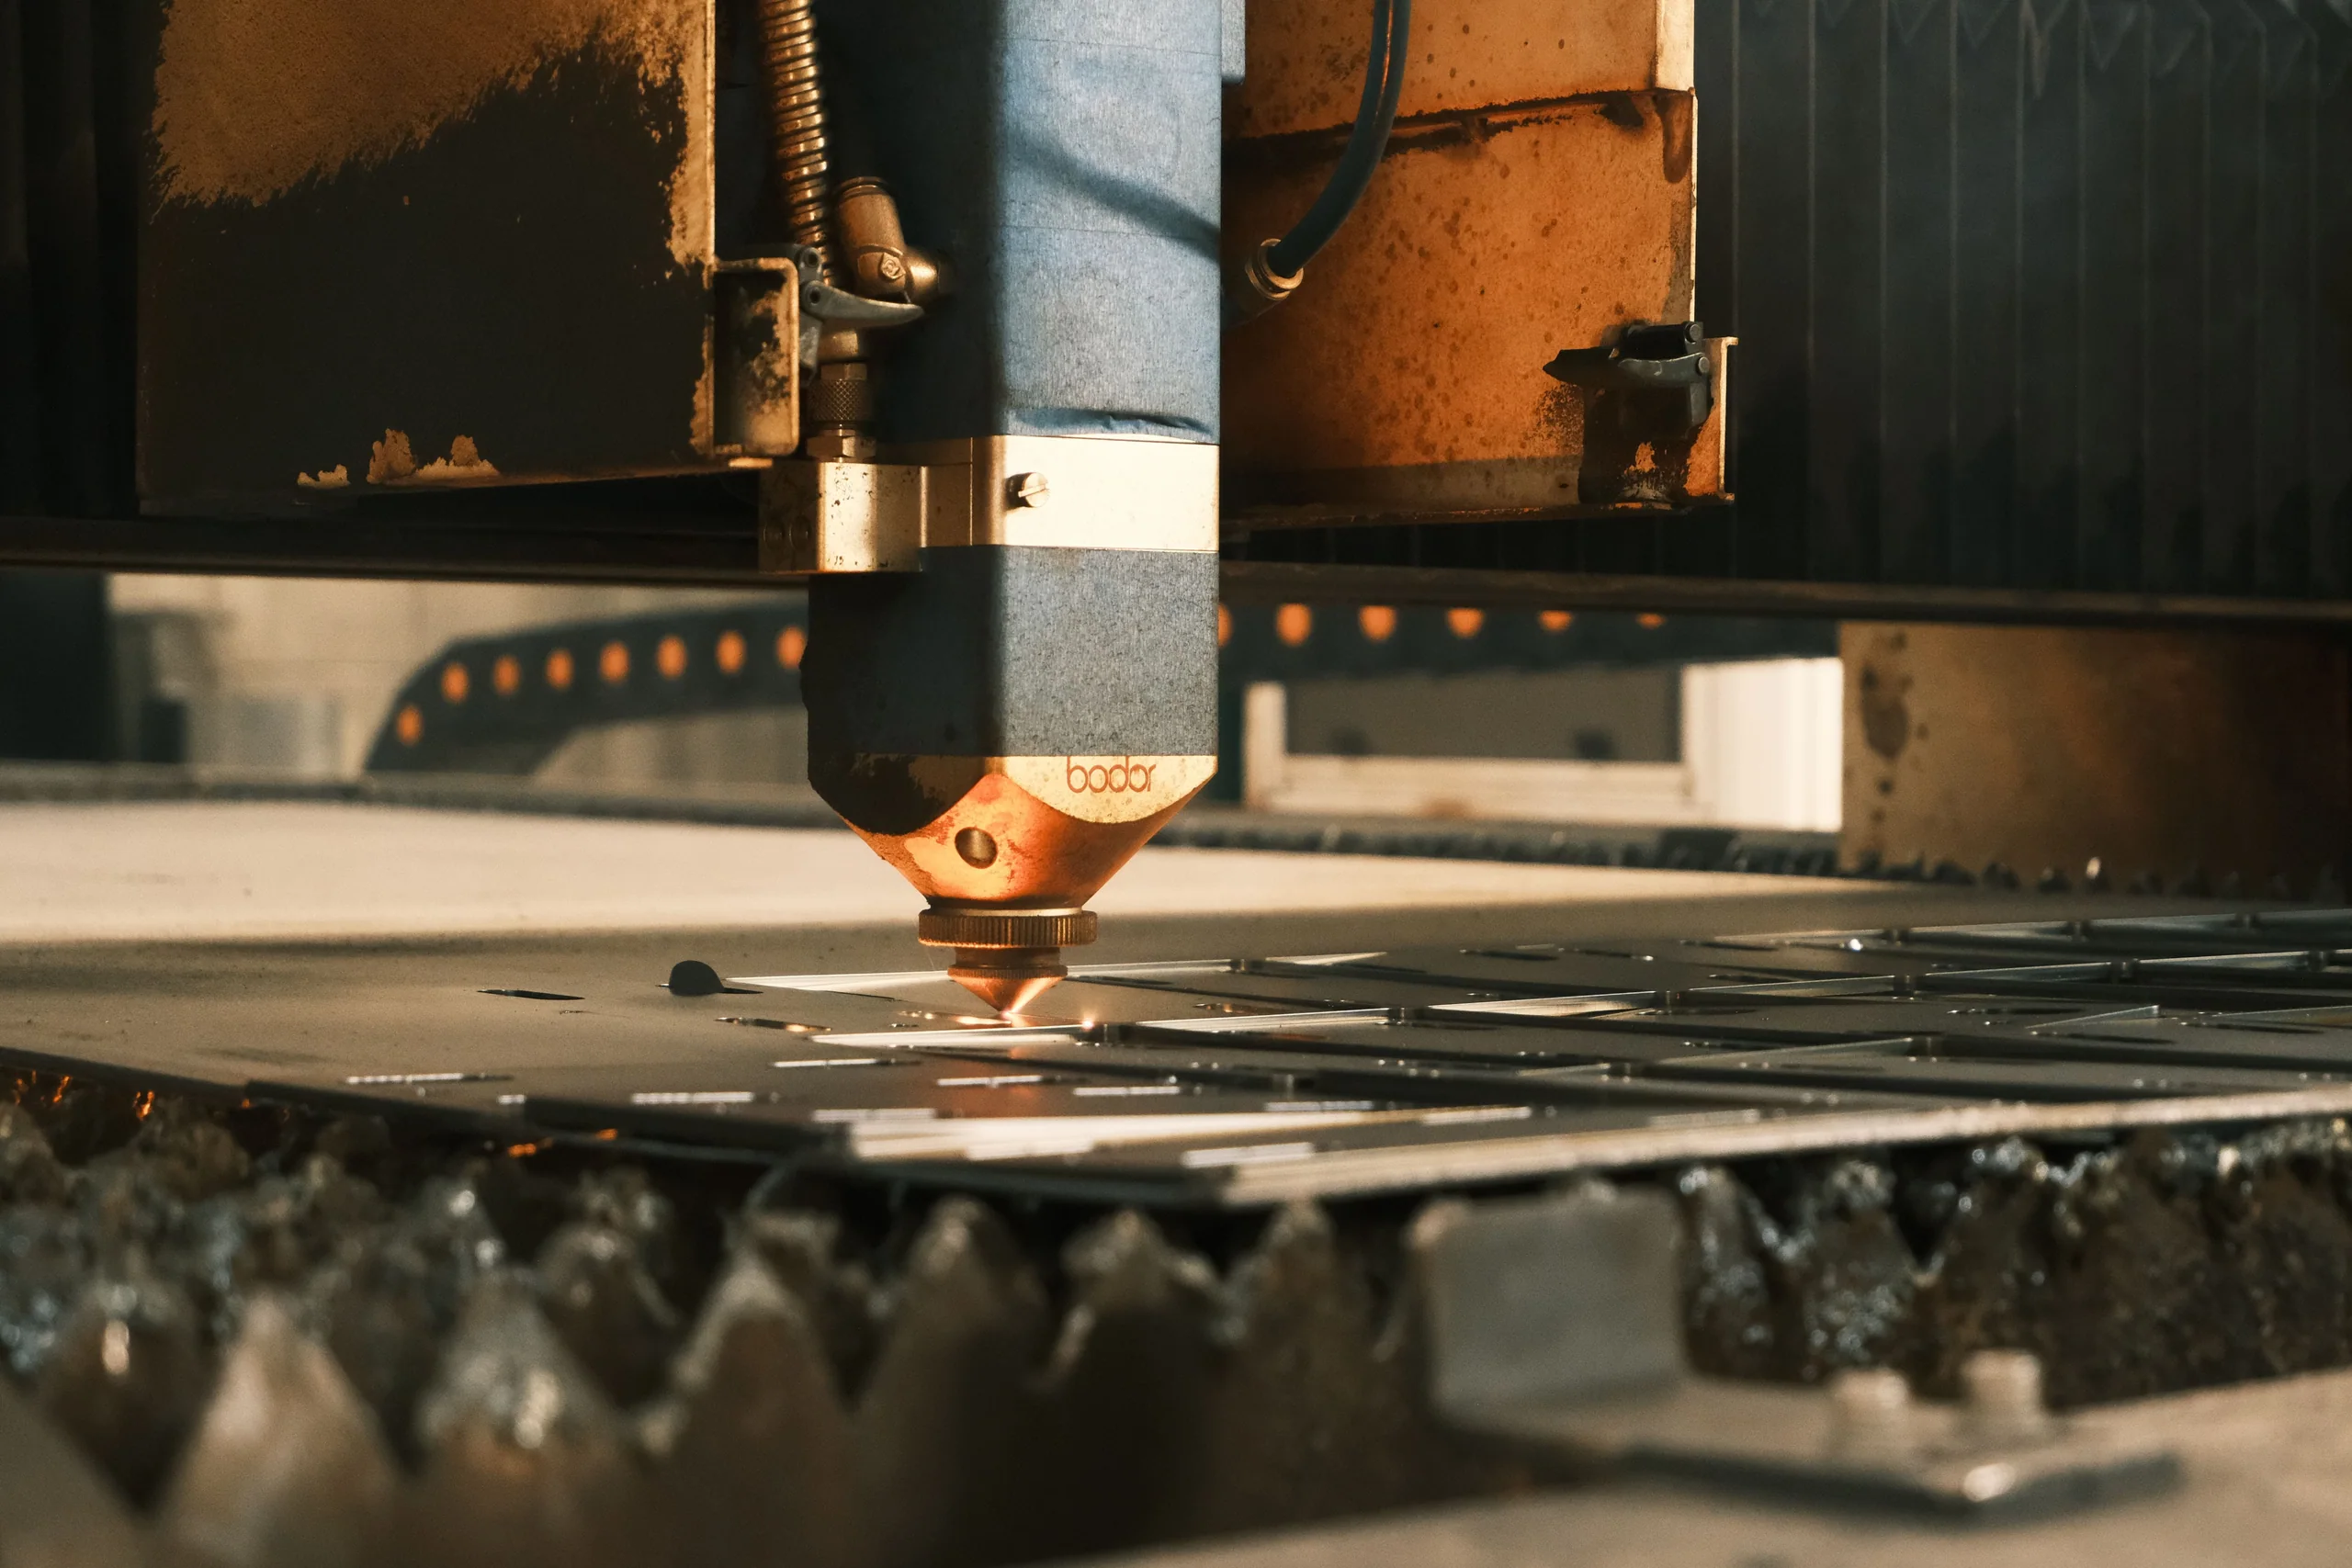
Many plants still run on end-of-shift guesses about why machines stopped. Agnotic Technologies builds machine monitoring software that connects old and new machines, turns signals into clear states, asks the operator for a reason at the machine and calculates OEE from what actually happened.
Trusted by global innovators










Machine monitoring software collects signals from machines on the shop floor and turns them into live status, downtime records and OEE. Agnotic Technologies builds it for plants that want this before, or without, a full MES: connections to machines of any age, state rules, operator reason codes, alerts and shift reports.
Not because people are careless. Because the data is collected the wrong way.
Downtime is written on a sheet at shift end, so short stops disappear and long ones are rounded.
Newer CNC machines report plenty of data while older machines report nothing, so the dashboard covers half the floor.
A machine that is powered on but waiting for material counts as running.
The reason code list has dozens of options, so operators pick the first one.
OEE is calculated in spreadsheets, with a different definition in each plant.
Alerts go to everyone, so nobody acts on them.
Most plants have all three. We survey each machine and record which row it falls in before we estimate the work.
| Machine type | Connection method | Signals available | State accuracy |
|---|---|---|---|
| CNC machine with an MTConnect agent or OPC UA for Machine Tools | Read the agent or OPC UA server over the plant network | Execution state, program, part count, spindle and feed values, alarms | High: states come from the controller itself |
| PLC-controlled line or cell | Read PLC tags through an OPC UA server or a protocol gateway | Run, fault and mode bits, counters, cycle complete signals | High when the tags exist; depends on what the PLC program exposes |
| Legacy machine with no usable controller | Retrofit current sensors or a stack light tap on an edge device | Power draw, stack light colour, and a part sensor where fitted | Moderate: states are inferred from load, so thresholds are tuned per machine |
When the main question is why machines stop, not how orders flow through the plant.
Monitoring answers availability and downtime questions with only machine connections and a reason screen. No routings, bills of materials or order integration are needed.
Machines, states and reasons are modelled so an MES can use them later, instead of becoming another island of data.
When you need work orders, genealogy and material tracking, that is the point to move to an MES, and the monitoring data carries over.
We build the monitoring layer. Failure prediction is covered on our predictive maintenance page, and plant-wide analytics on our IIoT data platform page.
MTConnect, OPC UA, PLC tags and retrofit sensors, read-only on the controller side.
Configurable rules that turn signals into running, idle, setup, down and planned stop.
A short tablet screen at the machine that asks for a reason while the machine is stopped.
Availability, performance and quality from states, counts and rejects, with one documented definition.
Notifications to the right person by machine, state and duration, not to everyone.
Downtime by reason, machine and shift, ready at the end of each shift.
A plant layout showing each machine's current state and how long it has been in it.
States and reasons sent to your warehouse or IIoT platform for wider analysis.
Chosen per machine type and per plant network.
Rules are set per machine and reviewed with the people who run it. These are typical starting rules.
| State | Example rule | Who confirms it |
|---|---|---|
| Running | Controller execution is active, or spindle load stays above the idle threshold for longer than a set time | Production lead for the cell |
| Idle | Powered and ready, but no cycle running and no reason entered yet | The operator, by entering a reason |
| Setup | The operator selects setup at the machine, or a program change is detected with no parts counted | The operator at the machine |
| Down | A fault or alarm is active, or the machine has stopped longer than the idle limit with a downtime reason | The operator enters the reason; maintenance closes it |
| Planned stop | Inside a break, meeting or planned maintenance window from the shift calendar | The shift calendar owner |
Measures that come straight from states and reasons.
Per machine, cell and shift.
Where the stopped hours actually go.
Small losses that never reach a paper log.
Stops still waiting for an operator reason.
First releases we scope, each small enough to prove on one part of the floor.
A handful of machines connected, states agreed and reasons captured.
Machines with MTConnect or OPC UA connected across a machining area.
Current sensors and stack light taps on machines with no usable controller.
A short, machine-specific reason list that operators actually use.
One documented OEE definition applied the same way in every plant.
Equipment makers and startups that want monitoring built into the machines they sell.
Machines on one side; planning, maintenance and analytics on the other.
We build secure, scalable products designed for privacy, interoperability, and regulatory readiness from day one across every sector we serve.

Adhering to the international gold standard for managing information security risks.

Ensuring consistent quality in software delivery and operational process optimization.
We combine deep technical expertise with industry-specific knowledge to deliver solutions that aren't just functional, but transformational.
We implement rigorous security protocols and compliance standards (HIPAA, GDPR, SOC2) across all industrial solutions to protect sensitive data.
Our architectures are built to handle massive data loads and user bases, keeping performance steady whether you're serving ten or ten million.
Using our suite of internal tools and proven frameworks, we cut setup work so your first release reaches users sooner.
Beyond simple wrappers, we build deep-learning integrations and predictive analytics directly into the core of your industry-specific workflows.
We start with a machine survey and one cell. We agree a fixed first release on the scoping call.
Machines, controllers, network rules and the downtime questions you need answered.
Each machine placed in the connection table, with the signals it offers.
One cell connected, states and reasons agreed, OEE reported.
More machines and areas on the same model, legacy retrofits included.
New machines, rule changes and reason list reviews under agreed support.
Short facts we design around, each linked to its primary source.
The MTConnect REST API is stateless and read-only, and it does not produce any side effects on the agent or the equipment it reports on.
Source: MTConnect Standard Part 1, Fundamentals, version 2.5.0MTConnect's Execution data item reports a component's operating state with values such as ACTIVE, READY (idle and ready to execute), INTERRUPTED, FEED_HOLD, PROGRAM_STOPPED and STOPPED.
Source: MTConnect Standard Part 3, Observation Information Model, version 2.5.0OPC UA for Machine Tools, Part 1, specifies an information model for machine monitoring and job management, giving a common interface across machine tools of different technologies, manufacturers and model series for MES, SCADA, ERP and analytics systems.
Source: OPC Foundation and VDW, OPC 40501-1, OPC UA for Machine Tools Part 1ISO 22400-2:2014 specifies a selected number of manufacturing operations KPIs, each presented with its formula and elements, time behaviour and unit, and relates them to work units as specified in IEC 62264.
Source: ISO 22400-2:2014, Key performance indicators for manufacturing operations management, Part 2We don't just build products; we forge lasting partnerships. See how we've helped industry leaders transform their vision into technical reality.
“I can clearly see how Agnotic has a unique way of handling end-to-end development. They are always active on quick chat and provide support quickly.”

Aaron Phelan
Founder, Benchmark
“Agnotic combines deep technical expertise with strong domain knowledge. They understand the business context, anticipate challenges, and make collaboration smooth and effective.”

John Pasmore
Founder, Latimer
“Agnotic is the best technical team we evaluated. Their engineering excellence made our work dramatically easier and allowed us to stay focused on what matters most for maternal care outcomes. They took full ownership of the technical execution, and we are always happy to continue working together.”

Kim Smith
Founder, My Lauren
This page covers machine status and downtime. These pages cover the systems that build on it.
Work orders, genealogy and quality gates, when monitoring is no longer enough.
Plant-wide data and analytics beyond machine states.
Failure prediction from condition and machine data.
Connecting machines and MES to ERP and other systems.
Our wider manufacturing practice.
Explore other production-grade engineering platforms we deliver across manufacturing.
The technical patterns behind this platform translate naturally into adjacent verticals.