

01
VEE for one commodity
Validation and estimation rules for electric interval data, replayed against past billing cycles.


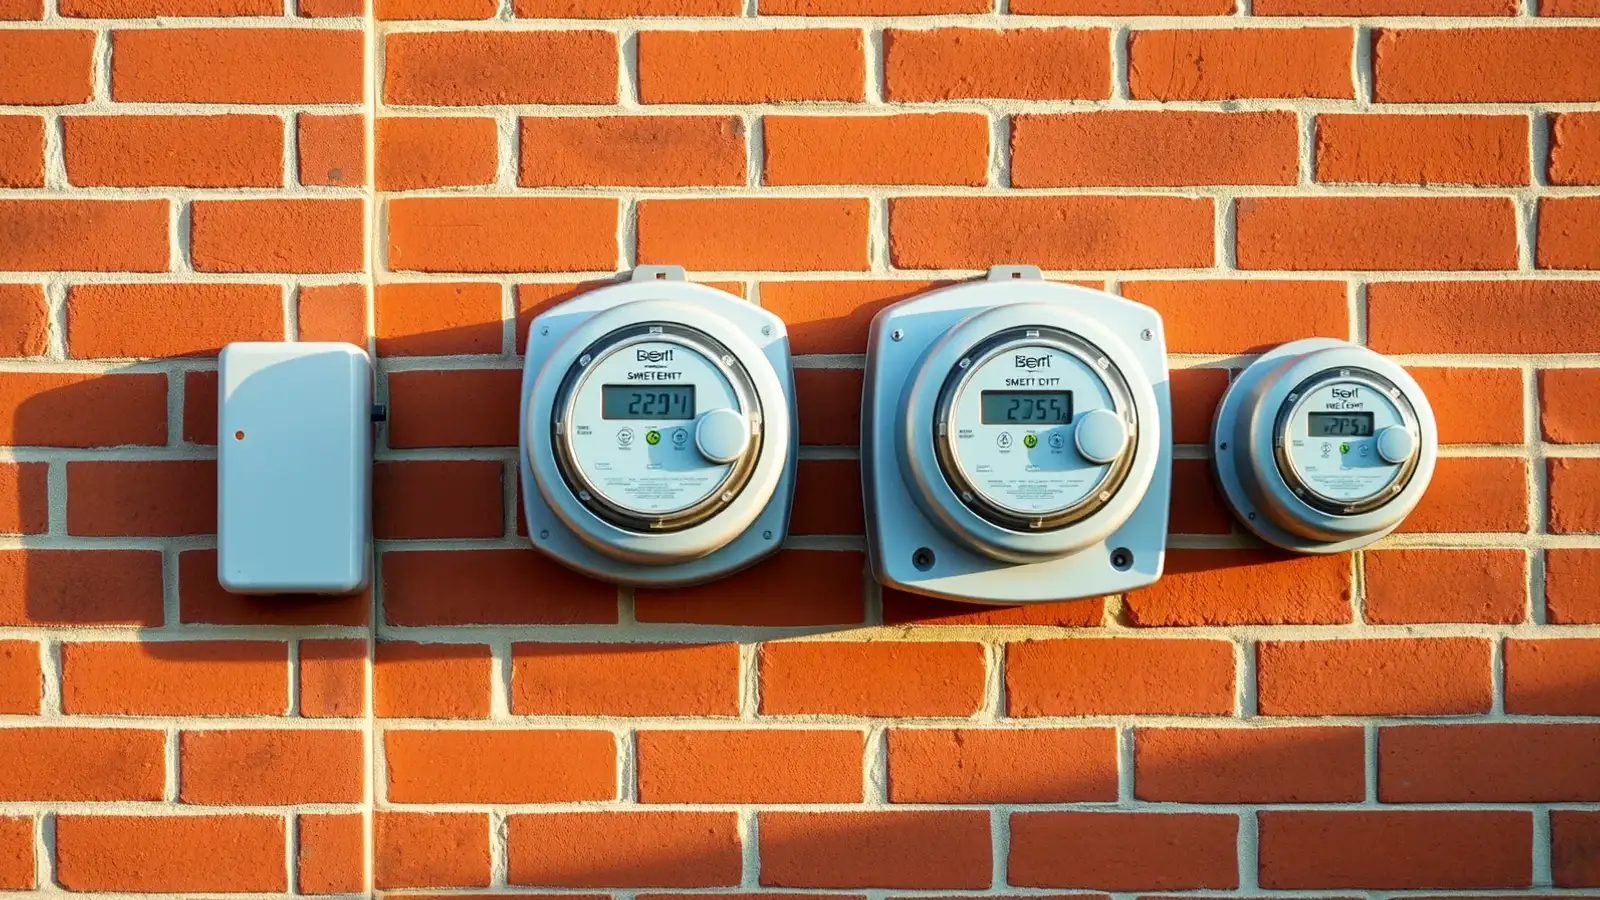
Interval reads arrive with gaps, spikes and reverse flow, and analysts end up arguing with billing over which number is right. Agnotic Technologies builds the validation, estimation and editing layer, revenue protection analytics and customer usage sharing on top of the AMI data you already collect.
Trusted by global innovators











Energy utilities analytics is the software that turns interval data from electric, gas and water meters into numbers a utility can bill, audit and share. Agnotic Technologies builds it around validation, estimation and editing (VEE), so every read is checked, gaps are estimated by a stated method, and revenue protection and customer reporting use the same data.
Head-end systems deliver reads on schedule, but not every read is usable. These are the conditions that turn a meter data project into a billing dispute.
Intervals go missing after a communication outage, leaving a register read with no interval profile behind it.
A meter exchange in the middle of a cycle splits one service point across two meter IDs, so usage is counted twice or not at all.
A wrong multiplier or CT ratio produces spikes that look like real demand until the customer calls about the bill.
Net-metered solar customers show reverse flow that a rule written for consumption-only meters fails as an error.
Estimated reads are overwritten by actuals with no record of what was billed, so a rebill cannot be explained.
Gas and water meters report less often than electric, and one set of thresholds applied to all three commodities produces false failures.
This is the rule set we start from on a scoping call. Your tariffs, your state's rules and your meter fleet decide the final thresholds; the structure of check, method and audit record stays the same.
| Validation check | What it catches | Estimation or edit applied | Audit field recorded |
|---|---|---|---|
| Gap | Intervals not received after a network or head-end outage | Linear interpolation for short gaps; a like-day or historical profile for longer ones, scaled to the register read | Estimation method, intervals estimated, source read IDs |
| Spike | An interval far above the meter's own history or the service's rated capacity | Held for review; replaced by a profile estimate only after an analyst confirms the read is wrong | Rule triggered, threshold used, reviewer and decision |
| Zero consumption | Intervals at zero on an active, occupied service point | Flagged for a field check; estimated from history once the meter is confirmed faulty | Account status at the time, field order reference |
| Register versus interval mismatch | The sum of intervals does not agree with the change in register reading over the same period | Intervals prorated to the register when the difference is within tolerance; escalated when it is not | Register start and end, interval sum, difference and tolerance |
| Reverse flow | Received energy on a meter that should only deliver, or channels swapped on a net meter | Net metering flag checked before the read fails; channel mapping corrected if swapped | Channel IDs, net metering status, correction made |
| Meter exchange | Two meters reporting for one service point in the same billing period | Period split at the exchange time, with both meters' reads joined to the service point | Old and new meter IDs, exchange timestamp |
Three choices made early keep the analytics honest and the billing team on side. As an energy utilities analytics services team, we make them with your billing, metering and customer leads before any dashboard is drawn.
Every interval passes VEE before it reaches a dashboard, a billing determinant or a customer download. Analysts work from validated data, never from raw head-end exports.
The original value is stored next to every estimate or edit, with the rule and method that produced it, so a rebill or a regulator's question can be traced read by read.
Electric, gas and water meters read at different intervals and fail in different ways. Each gets its own thresholds, replayed against your own history before go-live.
Modules that sit between your head-end or MDM and the teams that bill, protect revenue and serve customers.
Validation, estimation and editing rules per commodity, meter type and rate class, versioned so you can see which rules applied to any billing period.
Reads that fail a rule land in a queue with the meter's history beside them. Analysts approve, estimate or raise a field order, and each decision is logged.
Ranked leads for possible theft, tampering and unmetered load: tamper and cover-open events, usage that drops after a meter visit, consumption on inactive accounts and transformer totals above the meters behind them.
Validated usage and demand by billing period, sent to your CIS in the format it already accepts, with estimated periods marked.
Customer usage exports in the standard ESPI XML format from your customer portal, built from validated reads only.
Customer authorization of third parties, with the length of access the customer chooses and revocation at any time.
Reads that passed first time, were estimated, were edited or are still outstanding, by head-end, region and meter model.
For any read: the original value, every change, the rule or person behind it and the bill it fed.
This is how to build energy utilities analytics that billing trusts: the path every interval takes from the head-end to a bill, a report or a customer download.
Reads and meter events arrive from the head-end or MDM and are matched to the meter, the service point and the account active at that time.
Each interval runs through the VEE rules for its commodity and meter type, and every result is recorded against the read.
Short gaps are estimated automatically by the agreed method. Reads that need judgment, such as spikes and zero usage on occupied premises, are held.
Analysts work the exception queue before the billing window closes, with each decision written to the audit history.
Validated usage feeds billing determinants, revenue protection analytics and data quality reports from the same store.
Customers download their usage, and authorized third parties receive it through Green Button, always from the validated version.
Chosen around the head-ends and customer systems you already run.
Measures we build reporting around and review with your billing and metering leads.
Intervals that pass every rule with no estimate or edit, by head-end and meter model.
How many intervals were estimated and by which method, so a persistent gap shows up as a network problem.
How long failed reads wait for an analyst, measured against the billing window.
Leads opened from analytics and how many a field visit confirmed.
First releases we scope most often, each small enough to test against your own history.
Validation and estimation rules for electric interval data, replayed against past billing cycles.
Read-level history that shows what was billed, what changed and why.
Rules that treat reverse flow correctly for solar and storage customers.
A ranked list of possible tamper and theft cases for field investigation.
Standard usage exports in the customer portal.
Connect My Data with customer-controlled authorization.
The systems meter analytics reads from and writes back to.
We build secure, scalable products designed for privacy, interoperability, and regulatory readiness from day one across every sector we serve.

Implement lawful consent flows, data minimization, and secure processing for global data privacy.

Adhering to the international gold standard for managing information security risks.
We combine deep technical expertise with industry-specific knowledge to deliver solutions that aren't just functional, but transformational.
We implement rigorous security protocols and compliance standards (HIPAA, GDPR, SOC2) across all industrial solutions to protect sensitive data.
Our architectures are built to handle massive data loads and user bases, keeping performance steady whether you're serving ten or ten million.
Using our suite of internal tools and proven frameworks, we cut setup work so your first release reaches users sooner.
Beyond simple wrappers, we build deep-learning integrations and predictive analytics directly into the core of your industry-specific workflows.
It depends on scope; we agree a fixed first release on the scoping call.
We review your meter fleet, head-ends, current VEE handling and where billing disputes come from.
Candidate VEE rules run against a sample of your historical reads, so you see what each rule would have flagged before it touches a bill.
One commodity's VEE, the exception queue and the audit history, connected to your MDM or head-end export.
Revenue protection, Green Button sharing and further commodities on the same validated data.
Rule changes for new tariffs and meter models under agreed change control.
Short facts we design around, each linked to its primary source.
Green Button Download My Data is the part of NAESB REQ.21, the Energy Services Provider Interface (ESPI) model business practices, that lets customers download their electricity, natural gas or water usage from their provider's website in an industry-standard XML format.
Source: Green Button Alliance, Download My DataWith Green Button Connect My Data, a utility customer authorizes a third-party solution to obtain their interval meter data directly, and the customer can set how long that authorization lasts and revoke it at any time.
Source: Green Button Alliance, Connect My DataGreen Button data files and streams carry NAESB ESPI energy usage and retail customer XML elements inside a W3C Atom feed, which acts as the wrapper around the usage data.
Source: Green Button Alliance, Atom and ESPIForm EIA-861, the annual census of US electric utilities, collects the number of automated meter reading (AMR) and advanced metering infrastructure (AMI) meters by state, sector and balancing authority, and the energy served through AMI.
Source: US Energy Information Administration, Form EIA-861 data filesWe don't just build products; we forge lasting partnerships. See how we've helped industry leaders transform their vision into technical reality.
“I can clearly see how Agnotic has a unique way of handling end-to-end development. They are always active on quick chat and provide support quickly.”

Aaron Phelan
Founder, Benchmark
“Agnotic combines deep technical expertise with strong domain knowledge. They understand the business context, anticipate challenges, and make collaboration smooth and effective.”

John Pasmore
Founder, Latimer
“Agnotic is the best technical team we evaluated. Their engineering excellence made our work dramatically easier and allowed us to stay focused on what matters most for maternal care outcomes. They took full ownership of the technical execution, and we are always happy to continue working together.”

Kim Smith
Founder, My Lauren
This page covers making meter data billing-grade and using it. These pages cover the platforms around it.
The energy industry hub: grid, asset and energy data software Agnotic builds for utilities and renewable operators.
The lakehouse that stores AMI, SCADA and market data, including customer segmentation and rate design analytics.
Real-time grid views for control rooms, built on streaming telemetry rather than billed usage.
The wider grid platform: monitoring, distribution management and smart meter integration.
Outage detection and restoration; meter outage events feed both systems.
Program software whose settlement baselines also draw on interval meter data.
Explore other production-grade engineering platforms we deliver across energy.