


Dashboard Development
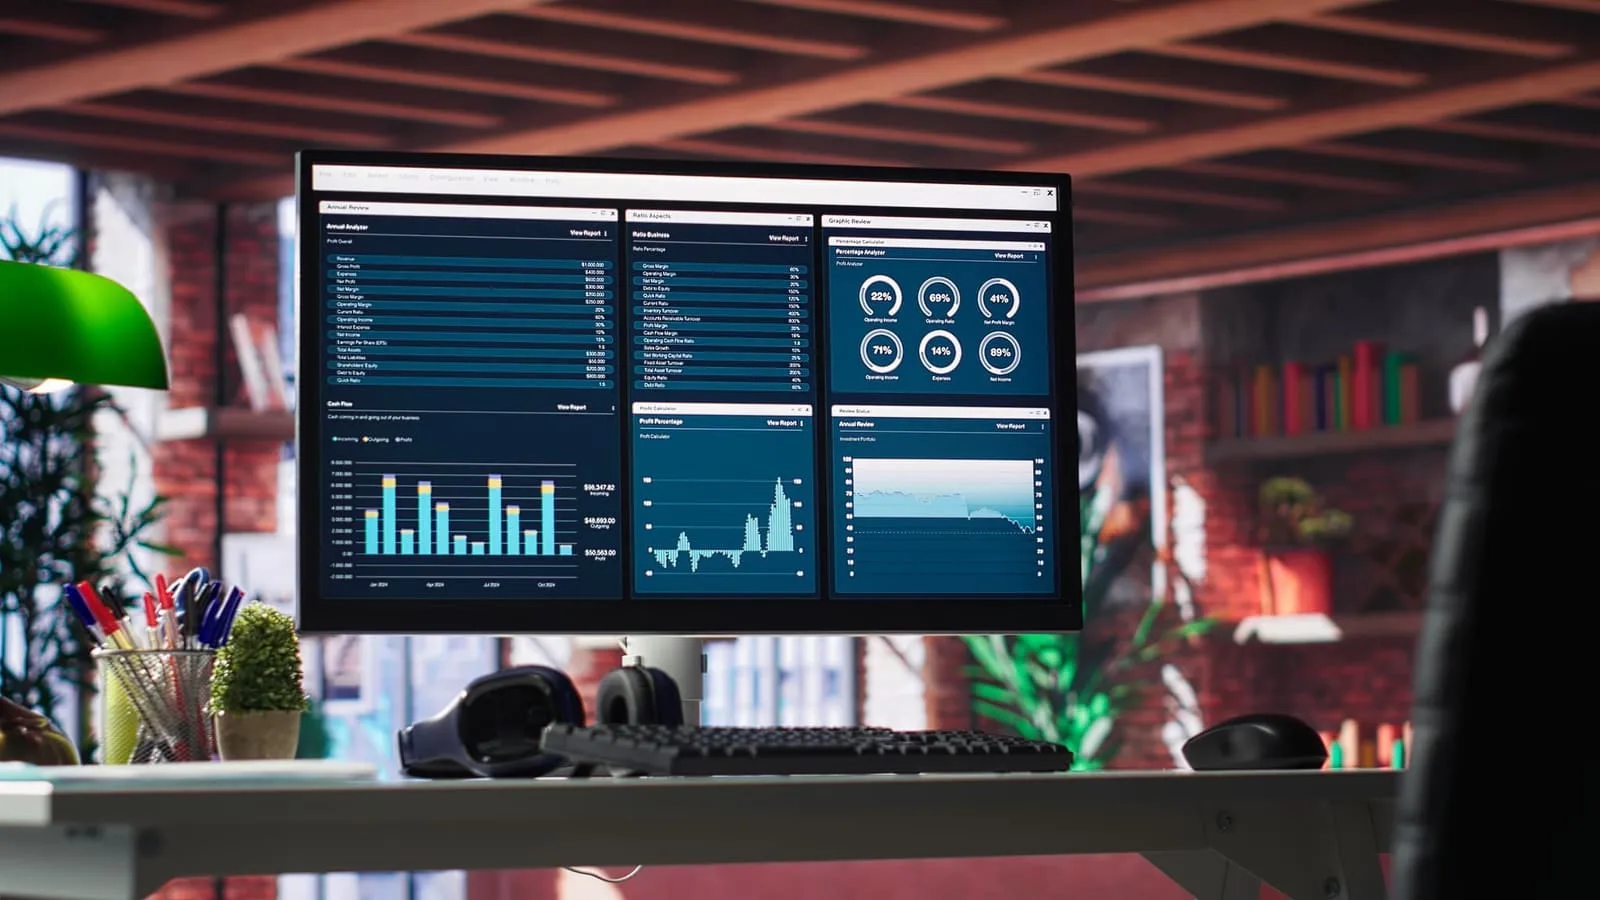
Custom dashboard development with data integration and interactive charts that turn complex data into real-time, actionable business intelligence.
Comprehensive Dashboard Development
At Agnotic Technologies, we specialize in custom dashboard development, helping businesses visualize key metrics and make data-driven decisions with intuitive, role-based dashboards.
Custom Dashboard Development
Build custom dashboards tailored to your KPIs, ensuring smooth user experiences, efficient data visualization, and optimized business intelligence insights.
Real-Time Data Integration
Use data integration to unify multiple sources into a centralized platform, providing accurate, real-time insights for informed decision-making.
Interactive Data Visualization
Enhance analytics with AI-powered data visualization tools, including charts, graphs, heatmaps, and database visualizers for intuitive and efficient data interpretation.
Role-Based Dashboards
Develop role-specific dashboards for executives, managers, and teams, ensuring relevant insights, personalized data, and enhanced decision-making efficiency.
Real-Time Projects
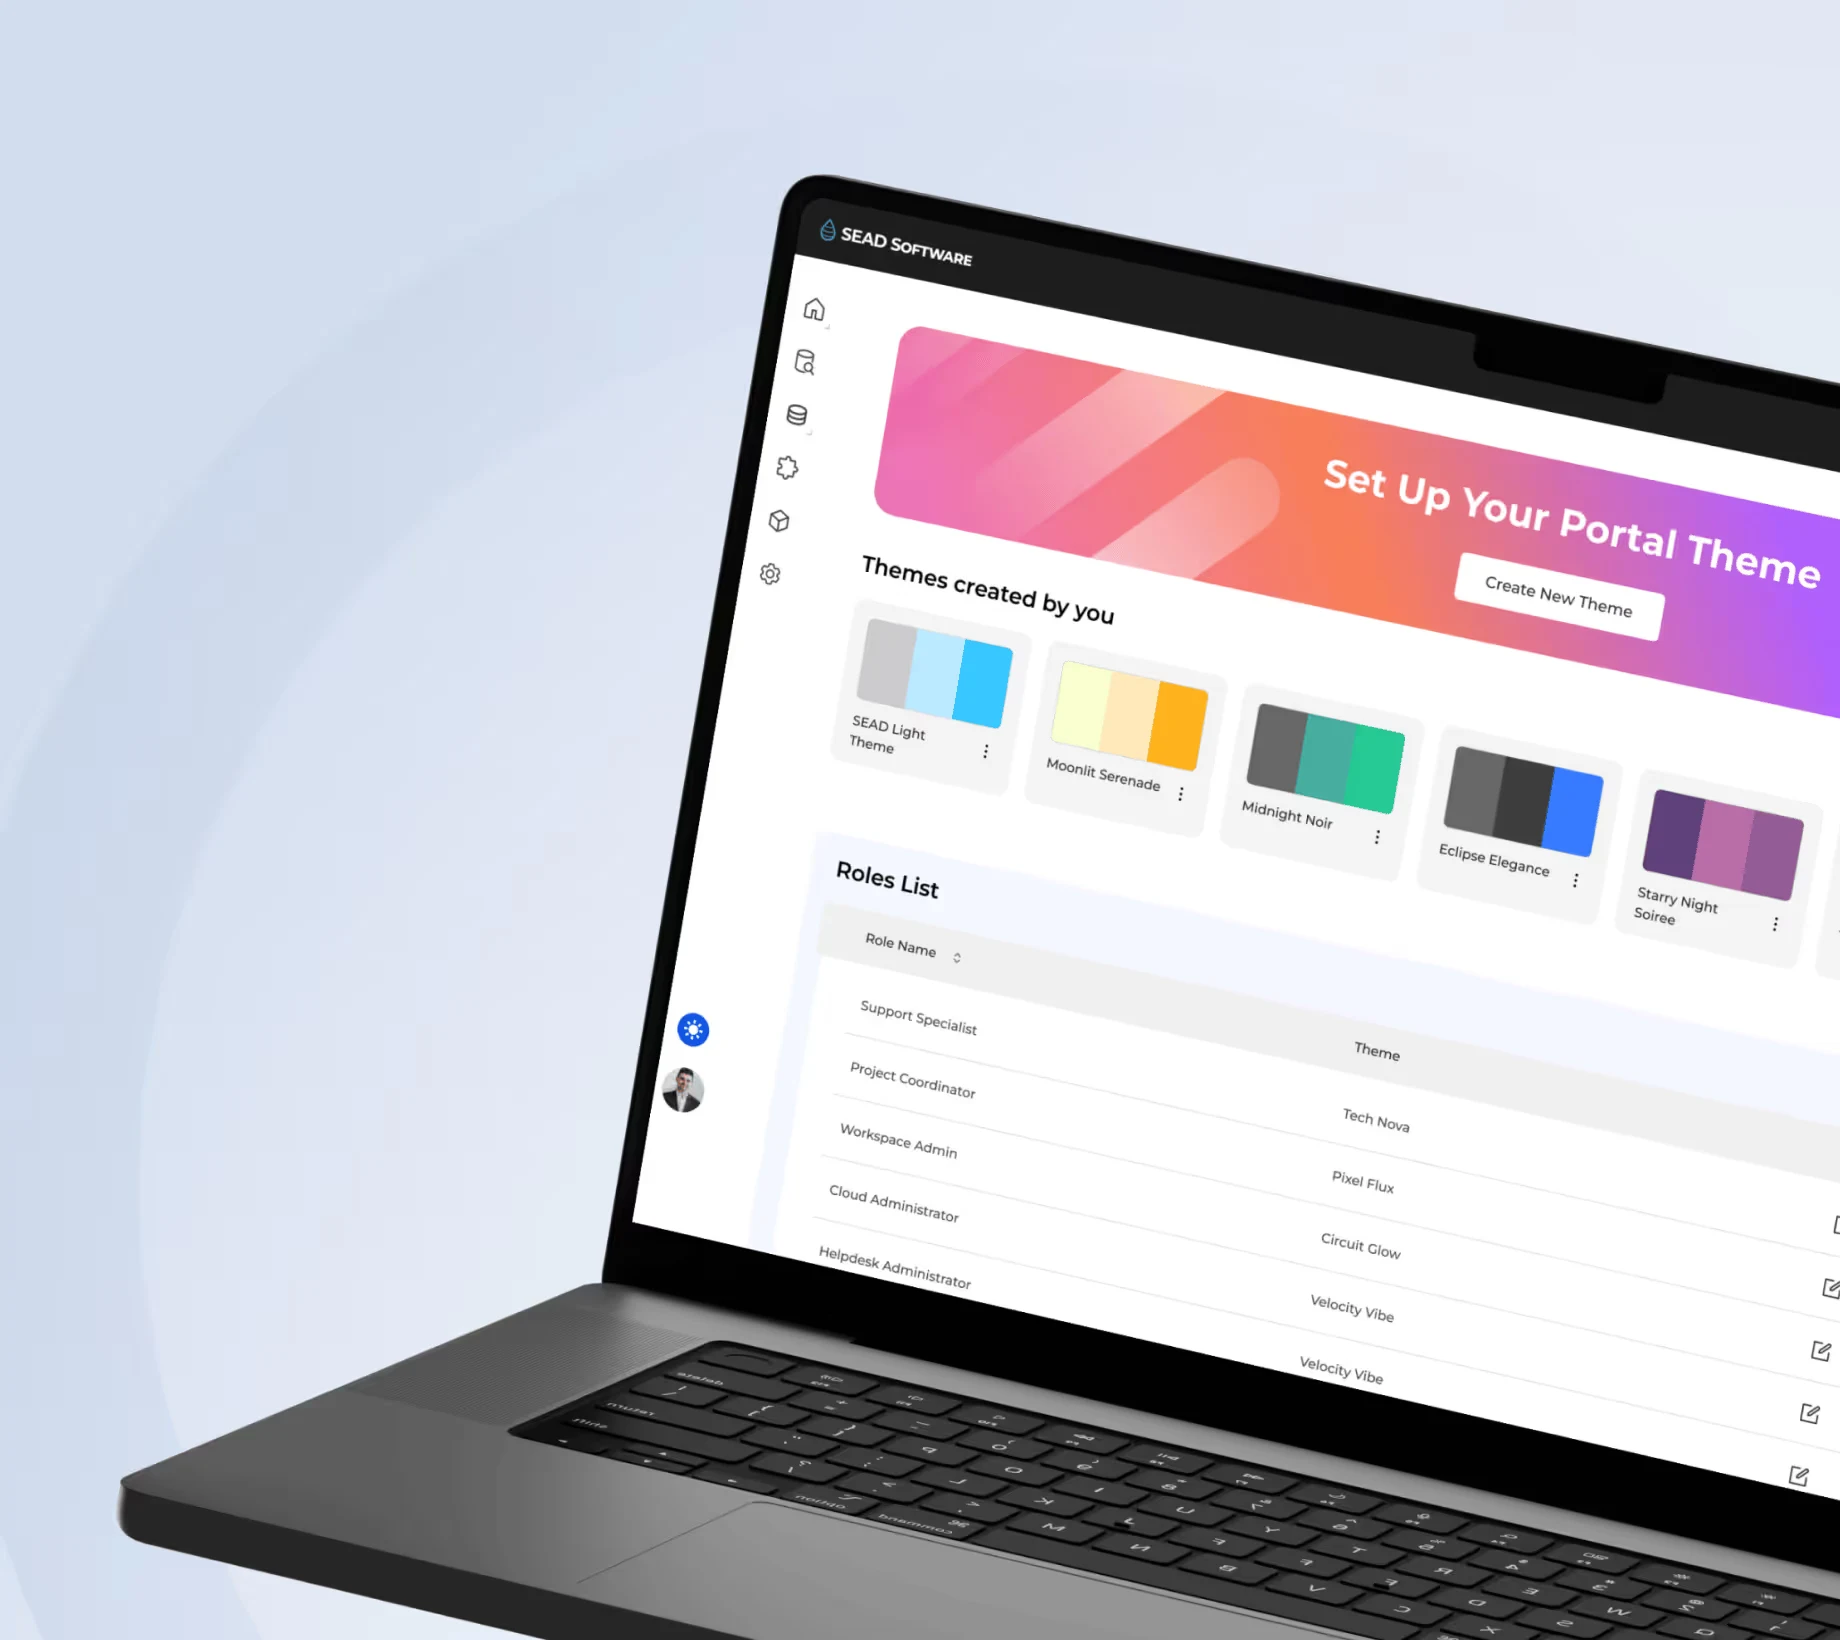
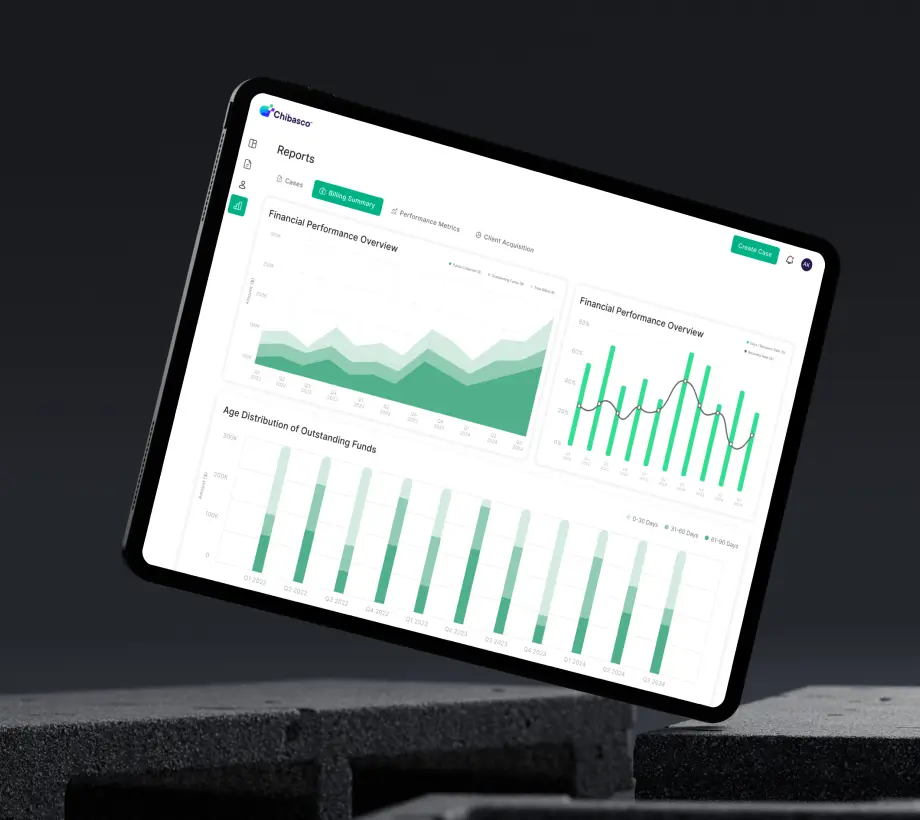
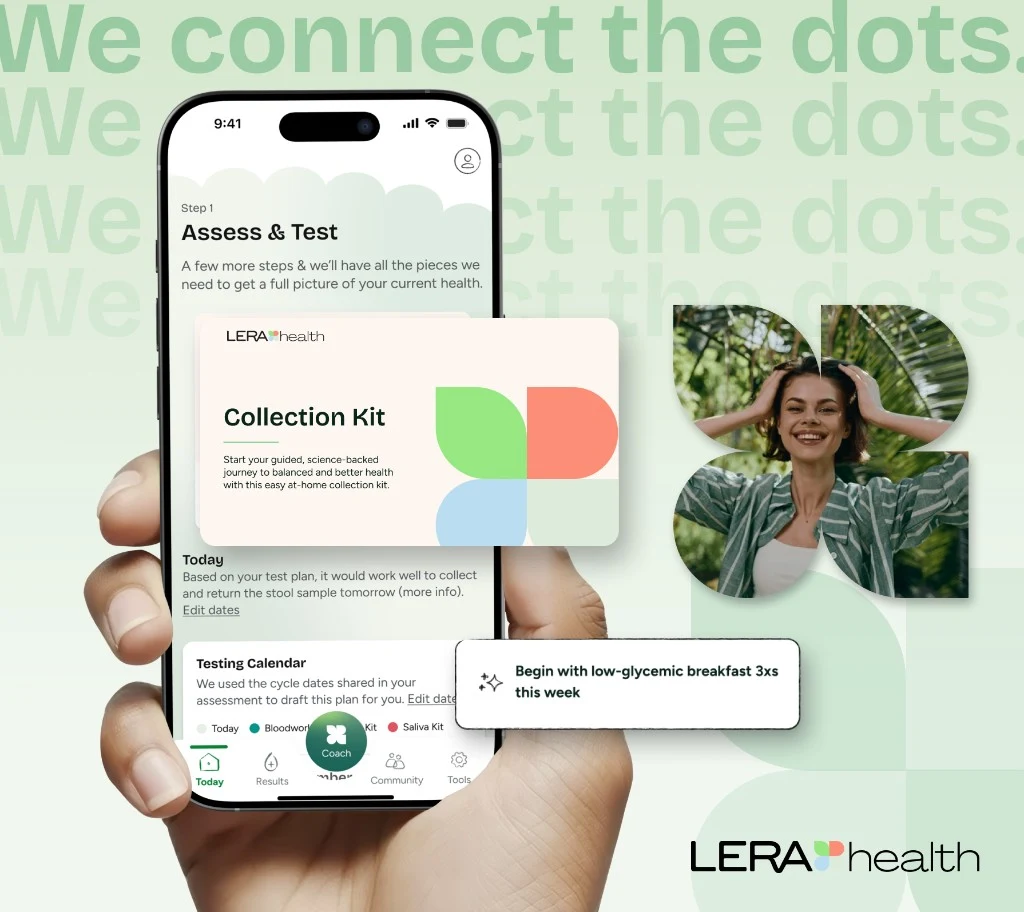
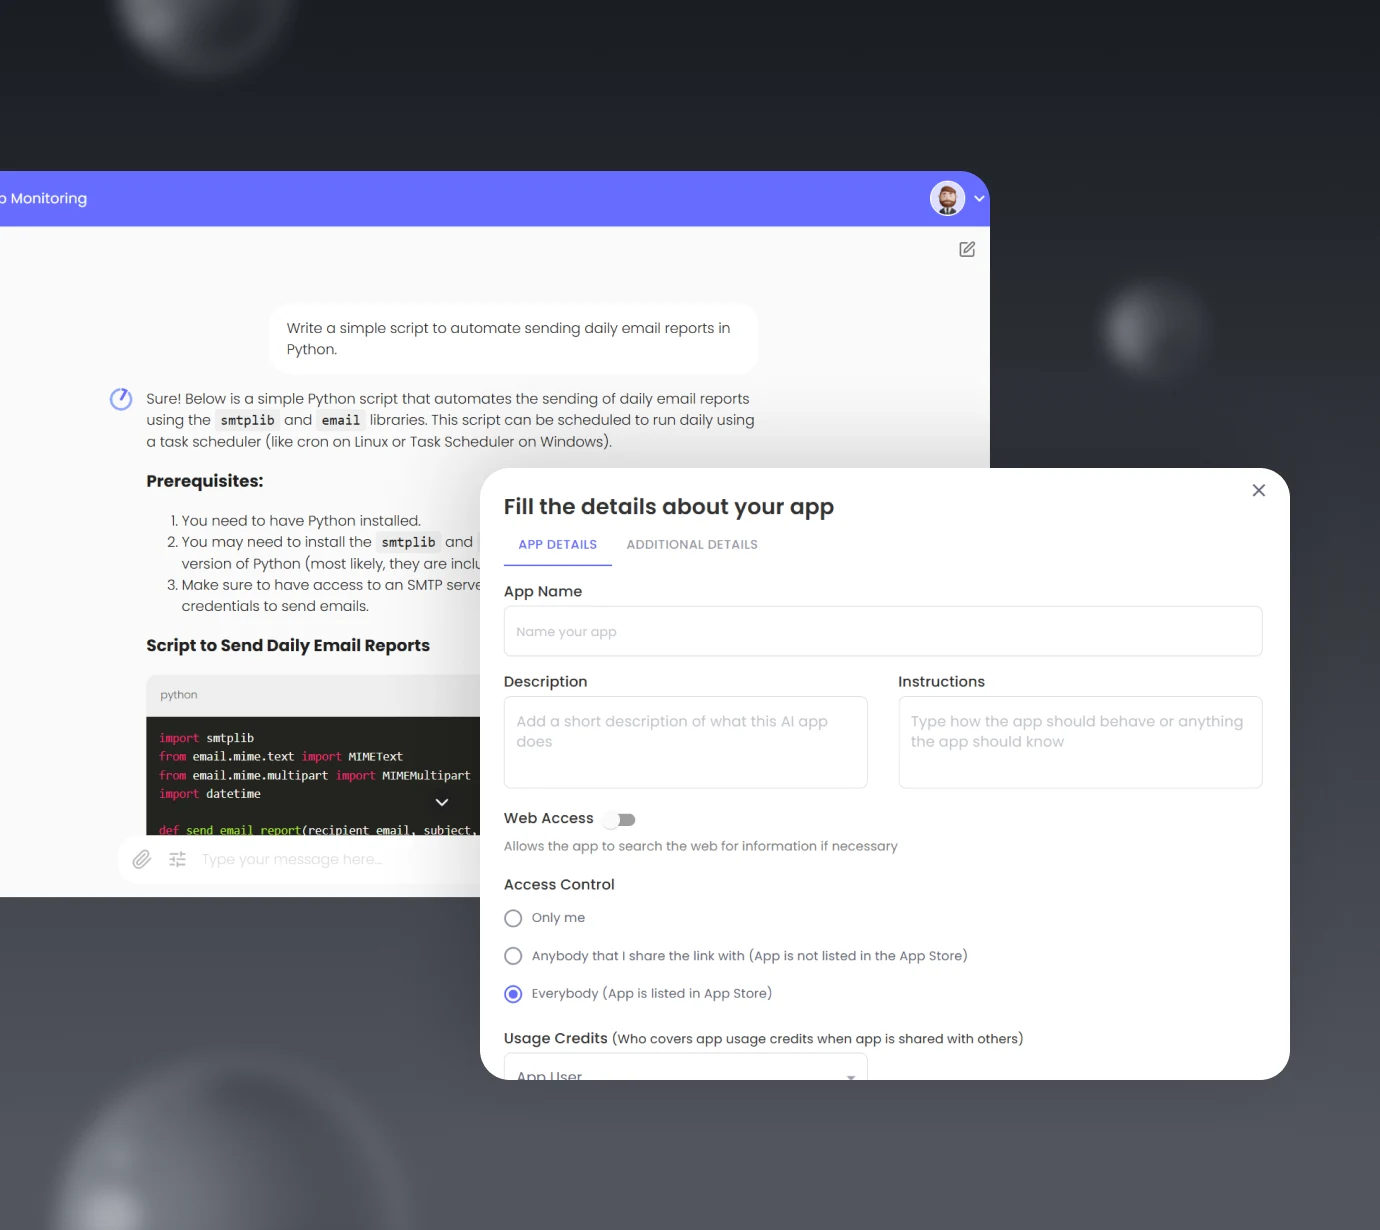
Transforming Data into Actionable Insights
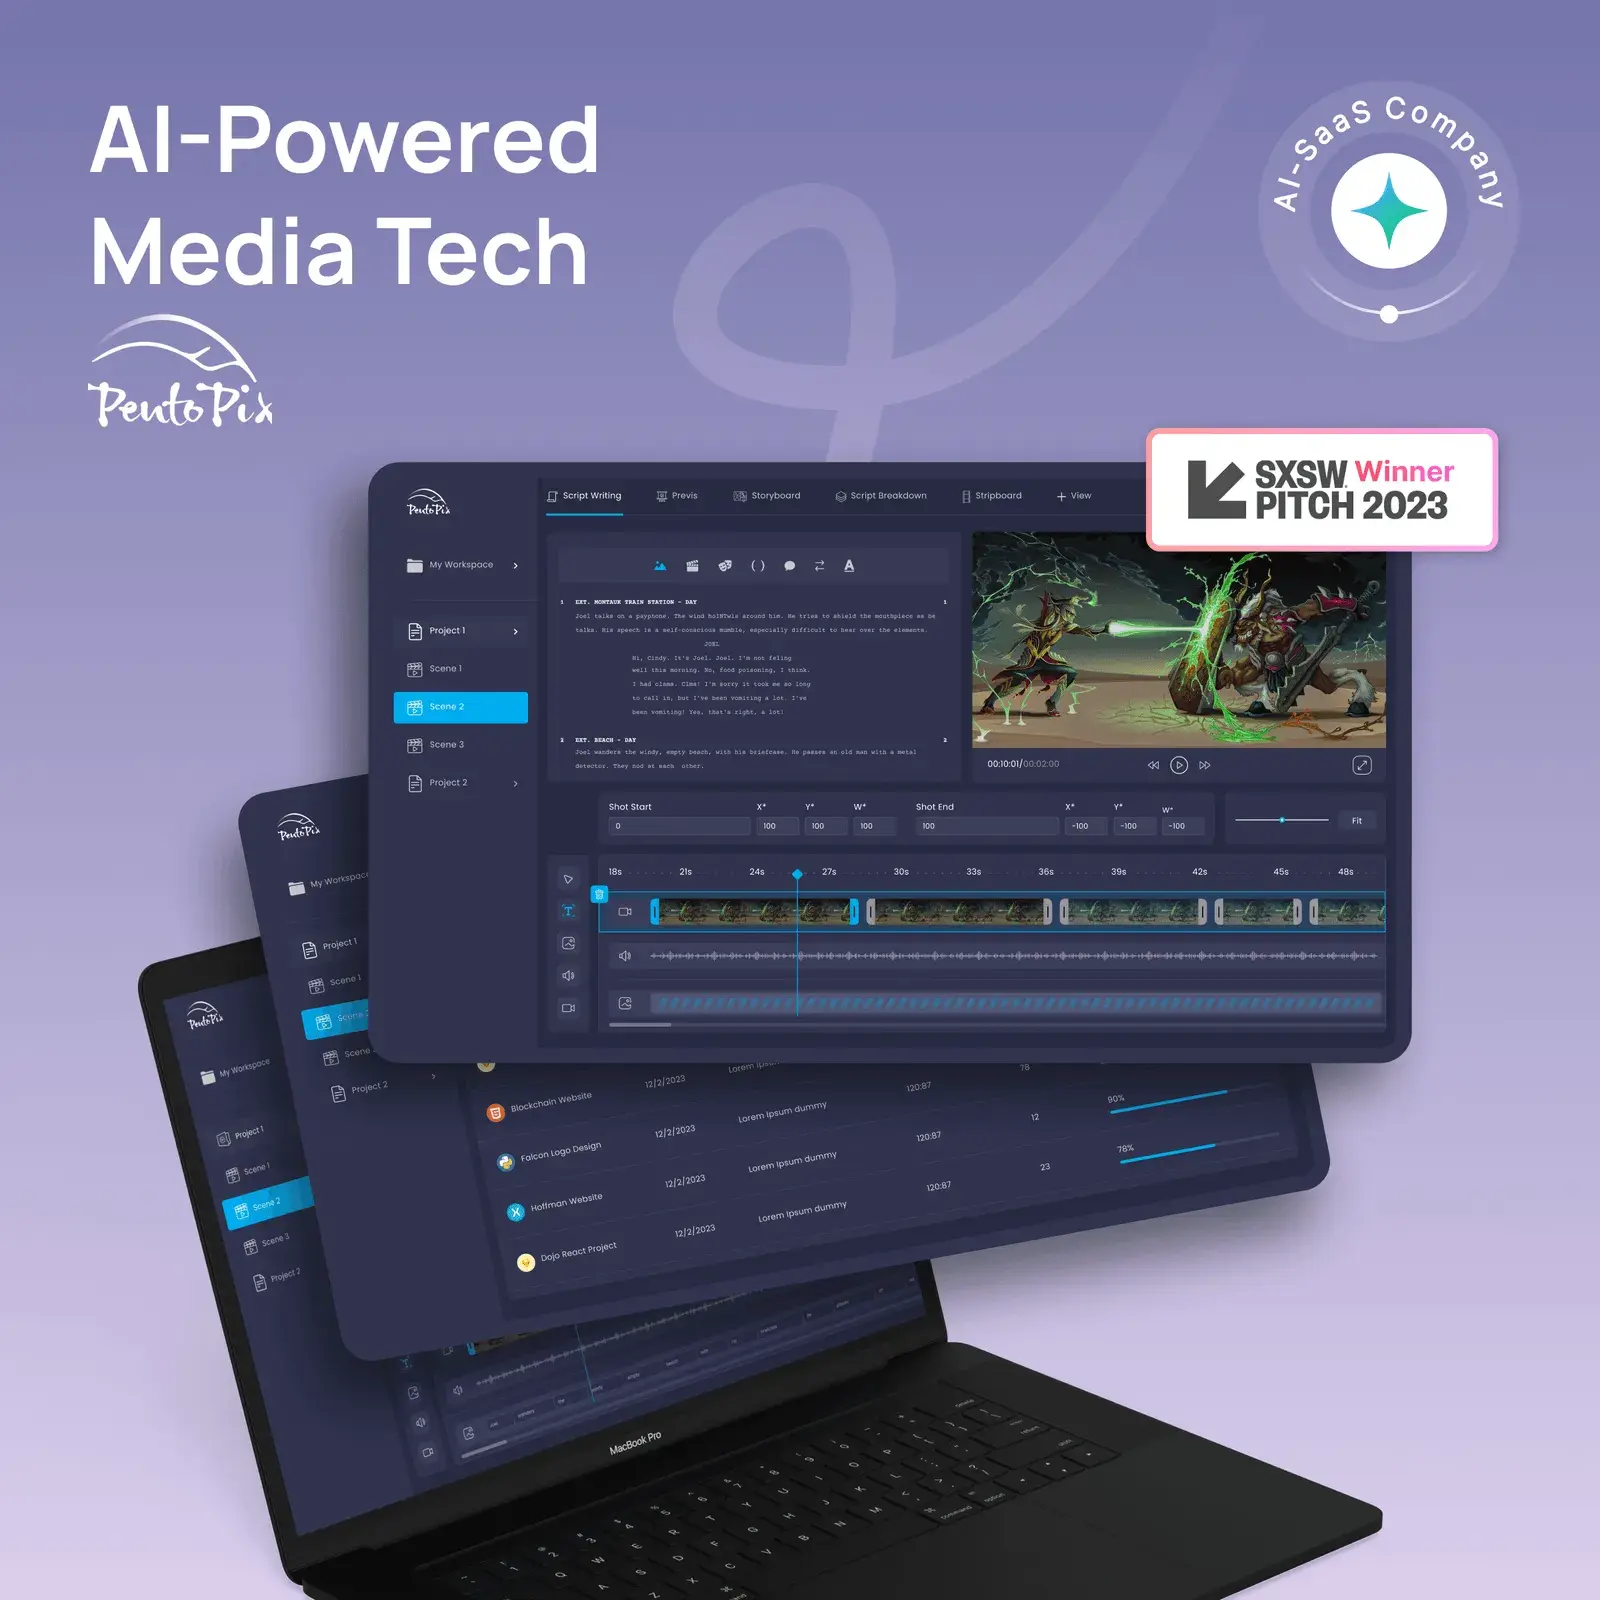
Agnotic creates powerful dashboards that enable businesses to make informed decisions.
Custom Solutions
Tailored dashboards designed to align with your specific KPIs and goals.
Real-Time Integration
Consolidate data from multiple sources for instant insights.
Interactive Visualizations
Use advanced visuals like charts, graphs, and heatmaps for better decision-making.
Role-Based Dashboards
Provide customized views for different stakeholders, ensuring relevance and clarity.
Predictive Analytics
Integrate AI-powered forecasting to stay ahead of trends and challenges.
Globally Trusted for
Dashboard Development




Global businesses trust Agnotic to deliver reliable, compliant software that drives success and fosters growth.
We Are Technology-Agnostic
With a diverse technology stack, we deliver solutions using a technology-Agnostic approach to meet your unique needs.
Wireframe & Ideation

User Experience
Voice of success
We don't just build products; we forge lasting partnerships. See how we've helped industry leaders transform their vision into technical reality.
“I can clearly see how Agnotic has a unique way of handling end-to-end development. They are always active on quick chat and provide support quickly.”

Aaron Phelan
Founder, Benchmark
“Agnotic combines deep technical expertise with strong domain knowledge. They understand the business context, anticipate challenges, and make collaboration smooth and effective.”

John Pasmore
Founder, Latimer
Sales Performance Dashboard for SaaS Company
A sales performance dashboard for a SaaS company visualizes pipeline performance and customer acquisition metrics. Agnotic Technologies connects it to real-time CRM data and adds filters, so sales teams can track leads, analyze conversion rates and see which strategies work.
We agree the measures with you before work starts, such as how quickly managers can answer a pipeline question, and report against them after launch.
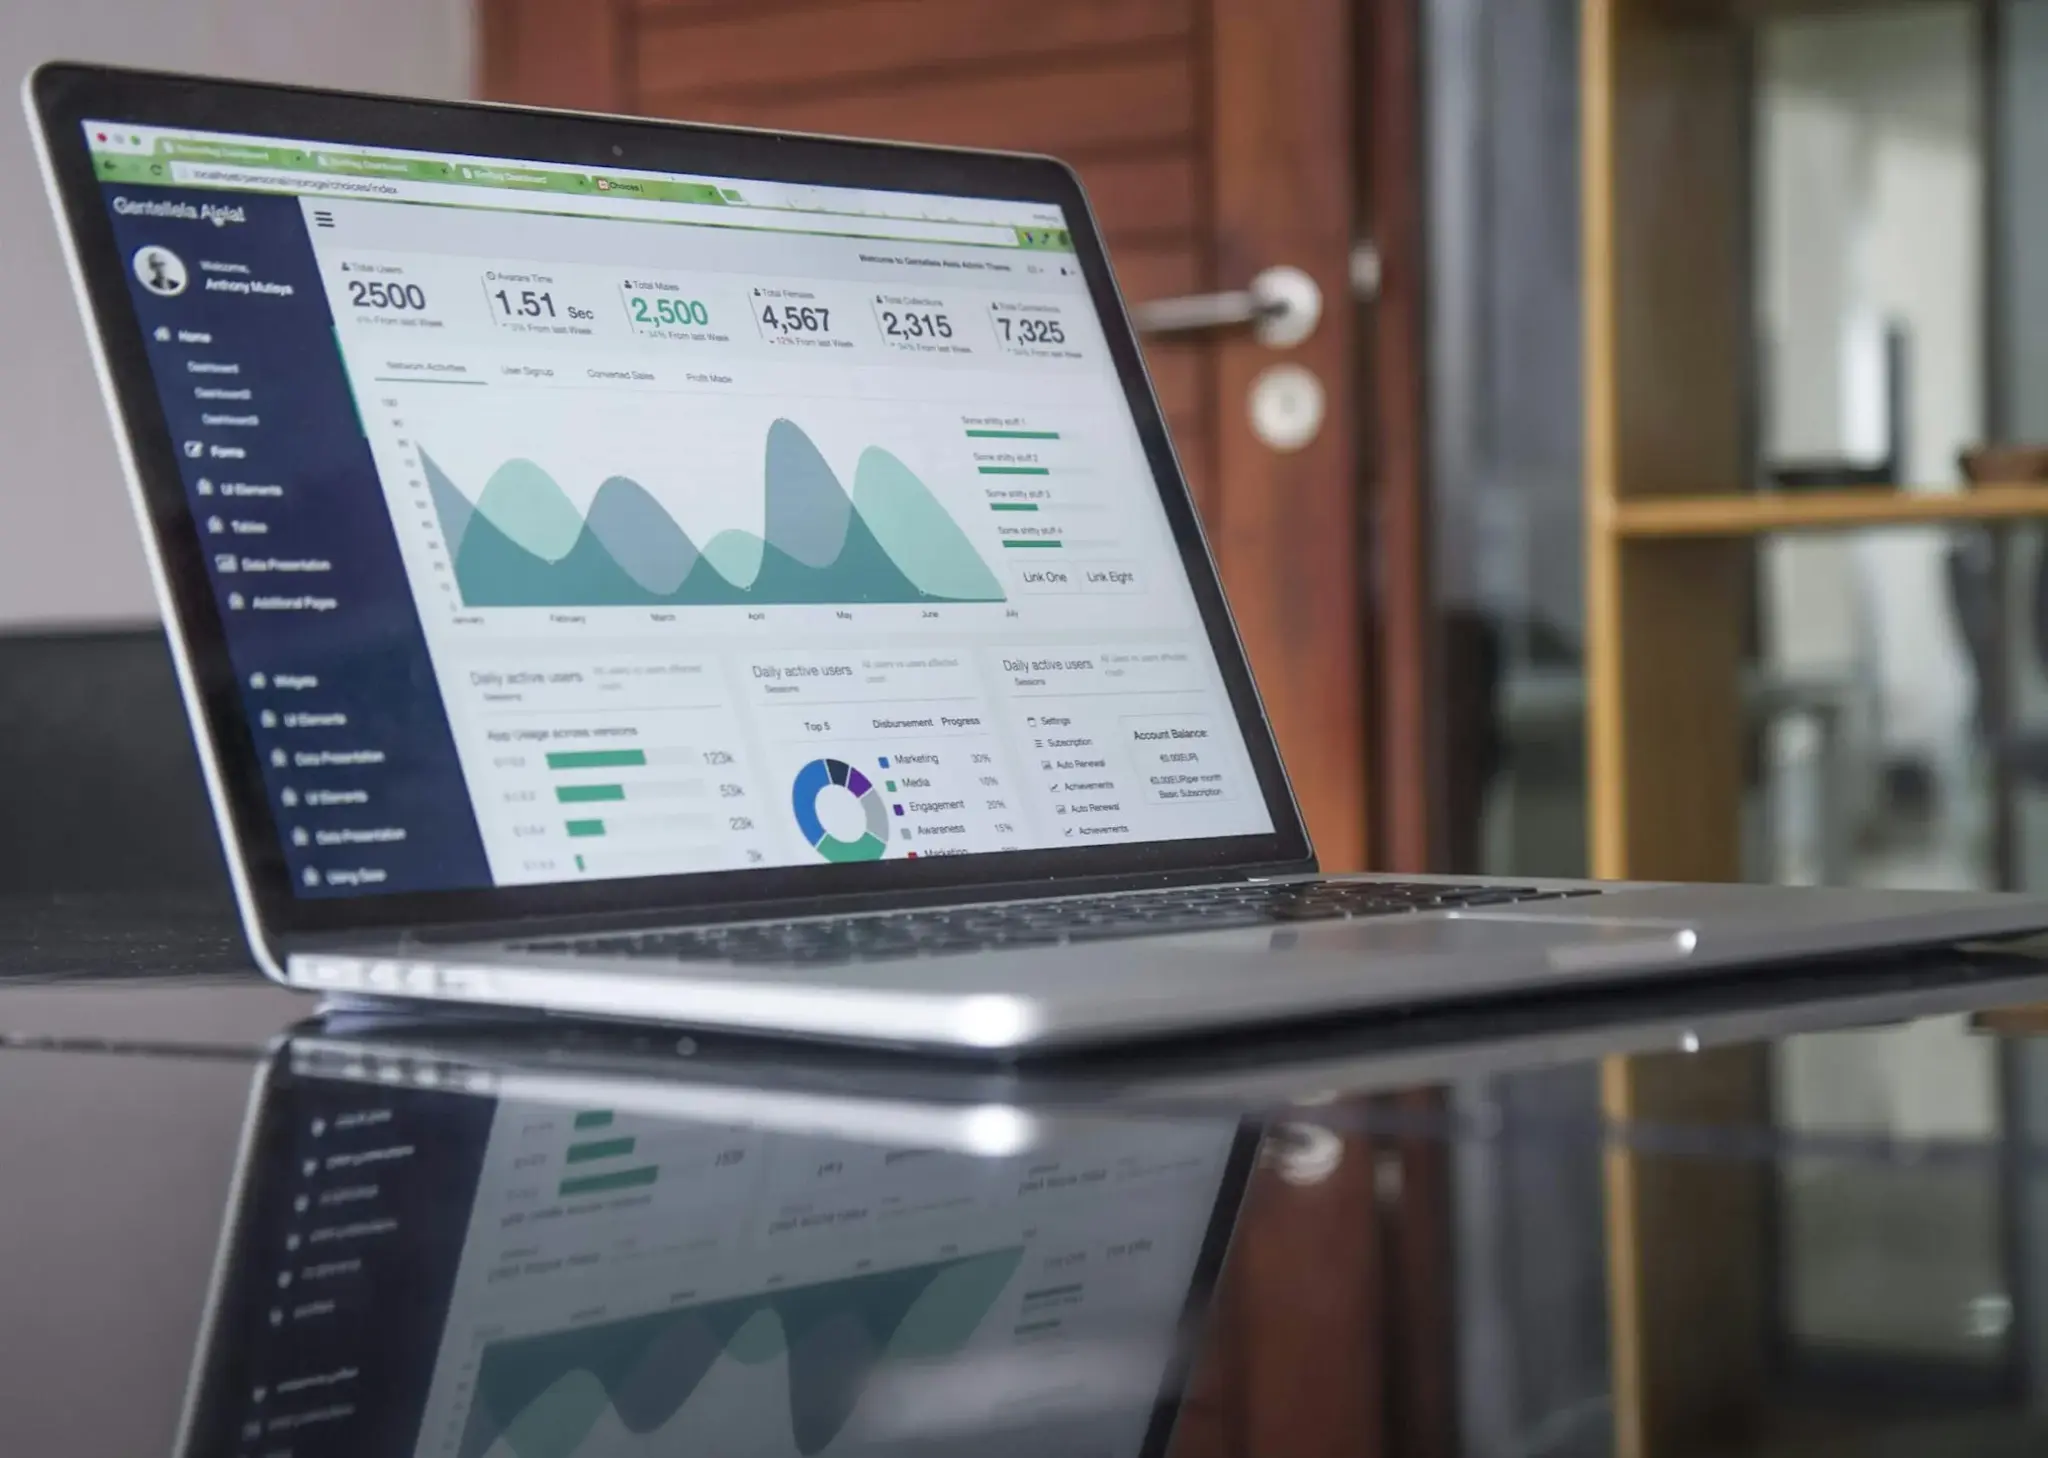
Predictive Analytics Dashboard for Manufacturing
A predictive maintenance dashboard for manufacturing analyzes equipment data to forecast failures before they occur. Agnotic Technologies builds it to show machine health in real time, so maintenance can be scheduled before unplanned downtime.
We agree the measures with you before work starts, such as unplanned downtime and repair costs, and report against them after launch.
Frequently Asked Questions
Let's build your Dashboard Development.
Tell us where you are and what you're building. We'll map the fastest, most reliable path to a production-ready result, and how we'd approach it.