Healthcare data visualization turns clinical, operational and financial data into charts and dashboards that people act on. A good one tells a nurse manager which patients need a call today or shows a revenue cycle lead where claims are stuck. A bad one hides stale data and mixes definitions.
This guide focuses on what makes a healthcare dashboard trustworthy: the data path behind it, how each metric is defined, who may see patient-level detail, chart choices that clinicians read correctly, and the accessibility rules that apply to charts in patient and clinician apps.
What is healthcare data visualization?
Planning clinical or operational dashboards?
Agnotic's healthcare fractional CTOs help teams design the data model, access rules and dashboards together, so the numbers people see are correct and safe to share.
Healthcare data visualization is the design and engineering of charts, dashboards and reports built from health data such as EHR records, claims and device readings. It includes the pipeline and metric definitions behind each number, the access rules on who sees patient-level detail, and visual design that clinicians and managers read correctly.
Four common kinds of healthcare dashboard
- Clinical: Patient or unit views of vitals, labs, medications and risk flags for care teams, often opened from the EHR.
- Operational: Throughput, wait times, bed capacity, staffing and schedule use for managers.
- Revenue cycle: Charges, denials, days in accounts receivable and payer mix for finance and billing teams.
- Quality and population: Measure rates, care gaps and risk groups across a panel, with drill-down to patient lists for authorized staff.
What sits behind a trustworthy healthcare dashboard?
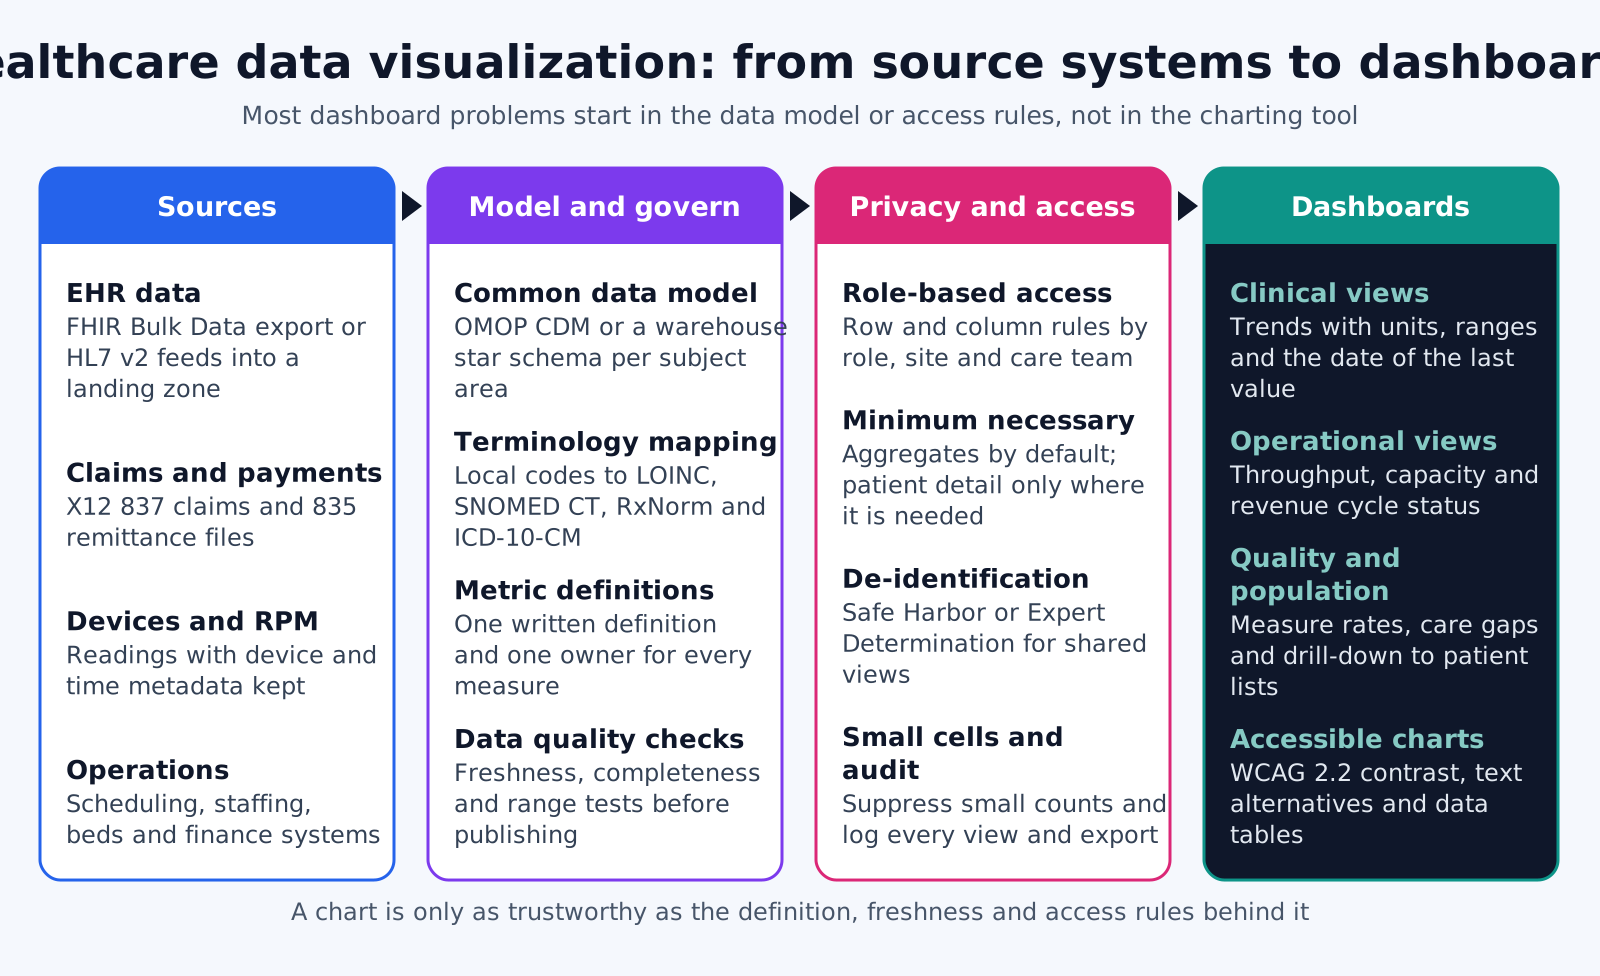
A trustworthy dashboard sits on four layers: sources, a governed data model, privacy and access rules, and the dashboard itself. When users say a number is wrong, the cause is usually below the chart: two teams defined the measure differently, a feed stopped, or an access rule hid part of the population.
- Sources: EHR data through FHIR Bulk Data $export or HL7 v2 feeds, X12 837 and 835 files, device readings with device and time metadata, and scheduling and finance systems.
- Model and governance: A common data model such as OHDSI OMOP or a warehouse star schema, local codes mapped to LOINC, SNOMED CT, RxNorm and ICD-10-CM, and freshness and range checks before data is published.
- Privacy and access: Row and column rules by role, site and care team, aggregate views by default, suppression of small counts in shared reports, and logging of every view and export.
- Dashboards: Trends with units, reference ranges and the time of the last value, plus text alternatives for every chart.
How should a metric be defined before it is charted?
Every metric needs a written definition with a numerator, denominator, exclusions, time window, source and owner before anyone draws it. Two dashboards that show different readmission rates for the same month destroy trust in both, and the fix is a definition, not a chart.
- Name and purpose: The metric name and the decision it supports, such as which patients to call this week.
- Numerator: Exactly which events count, with the codes or fields used to find them.
- Denominator: The population at risk, including how patients enter and leave it.
- Exclusions: Who is removed and why, for example hospice patients or transfers.
- Time window: Calendar month, rolling 30 days or measurement year, and which date field anchors it.
- Source and refresh: The tables or feeds used and how often the metric updates.
- Owner and version: The person who approves changes, with a version number shown on the dashboard.
Where a metric follows a published specification, such as a CMS quality measure, link the definition to the specification version rather than paraphrasing it.
Late-arriving data
Claims arrive weeks after the visit, and lab results can be corrected after release. Decide in the definition whether a past month's figure may change, mark recent periods as provisional on the chart, and keep a snapshot of what was shown when a number was used for a decision or a report to a payer.
Who may see patient-level detail?
Staff with a treatment, payment or health care operations purpose may see patient-level detail inside the organization, within minimum necessary limits. Data leaving those purposes, such as a public report or a share with a party outside a business associate relationship, needs de-identification, a limited data set agreement or another HIPAA basis.
- Internal operations: 45 CFR 164.506 permits a covered entity to use PHI for its own health care operations, which includes quality assessment and improvement, so an internal quality dashboard does not need de-identified data.
- Role-based views: The minimum necessary standard applies to internal uses, so a scheduling dashboard should not show diagnoses. It does not apply to disclosures to a provider for treatment (45 CFR 164.502(b)(2)).
- Data that leaves those purposes: HHS guidance describes the Safe Harbor and Expert Determination methods for de-identifying data before it is published or shared without another HIPAA basis.
- Small cells: The CMS cell size suppression policy for CMS data prohibits displaying counts from 1 to 10 and values from which such counts can be derived, a useful reference point for any shared report.
Keep patient detail one deliberate step away: show aggregates first, then require an authorized, logged drill-down to reach a patient list.
Sharing with research or analytics partners
When a partner needs dates or ZIP codes that Safe Harbor would remove, a limited data set shared under a data use agreement (45 CFR 164.514(e)) is often the better route than full de-identification. The agreement names the permitted uses, and the dashboard or extract should carry only the fields it allows.
Chart choices that clinicians read correctly
Clinicians read dashboards in seconds between tasks, so clarity beats density. These choices reduce misreading.
- Units and ranges on every value: A potassium of 5.8 means little without mmol/L and the reference range beside it.
- Time of last value: Show when each value was recorded and when the dashboard last refreshed, so a stale number is visible.
- Denominators beside rates: Write 12 of 40 as well as 30 percent, so a small panel does not look like a crisis.
- Consistent scales: Keep the same axis range across small multiples, and avoid dual-axis charts that invite false comparisons.
- Tables for exact values: Use a table when users need to look up a number, and a line chart when they need the trend.
- Few metrics per screen: A screen with a handful of action-driving numbers gets used. One with dozens gets ignored.
Showing risk scores
A risk score on a dashboard needs its context next to it: the model name and version, the date it was calculated, and the main inputs that drove it, so a clinician can judge it rather than obey it. Under Section 1557 at 45 CFR 92.210, covered entities must not discriminate through patient care decision support tools, so teams that display scores should also review how those scores perform across patient groups.
Which accessibility rules apply to charts?
For providers that receive HHS federal financial assistance, the Section 504 rule at 45 CFR 84.84 adopts WCAG 2.1 Level AA for web content and mobile apps, which includes charts in patient portals and apps. Compliance dates are 11 May 2027 for recipients with 15 or more employees and 10 May 2028 for smaller ones.
- Use of color: WCAG 2.1 success criterion 1.4.1 says color must not be the only way to convey information, so add labels, patterns or shapes to colored series.
- Non-text contrast: Criterion 1.4.11 requires a contrast ratio of at least 3:1 for graphical objects needed to understand the content, such as chart lines and markers.
- Text alternatives: Criterion 1.1.1 requires a text alternative for non-text content. For a chart, that means a summary of the finding plus access to the underlying table.
- Keyboard access: Filters, tooltips and drill-downs must work without a mouse.
BI tool, EHR-embedded view or custom build?
Use a BI tool for internal operational and financial reporting, embed clinical views in the EHR when clinicians need them during care, and build custom visualizations for patient-facing apps and products you sell.
- BI tools: Power BI, Tableau or Looker work well once the data model is solid. Check row-level security, export controls and audit logging before PHI goes in.
- EHR-embedded: A SMART on FHIR app opens in patient context inside the EHR, so clinicians do not log in twice or search for the patient again.
- Custom: Patient-facing and commercial products usually need full control of design, performance and accessibility.
Where dashboards lose user trust
- Silent staleness: A feed stopped two days ago and the dashboard shows no warning.
- Definition drift: A metric's logic changed without a version note, so this month cannot be compared with last month.
- Uncontrolled exports: Unrestricted downloads to spreadsheets bypass access rules and audit logs.
- Unmapped codes: A polished chart on top of unmapped local codes spreads wrong numbers faster.
- Missing population: An access rule or a failed site feed removed patients from the denominator and nobody noticed.
- Orphaned dashboards: Nobody owns the view, so questions about a number go unanswered and users build their own spreadsheet instead.
How Agnotic can help
Most dashboard problems are data problems that surface on a screen. Agnotic Technologies' healthcare fractional CTOs help digital health teams, provider groups and payers fix them at the source: governed pipelines from EHRs and claims, written metric definitions with owners, role-based access and suppression rules, and clinical, operational and population dashboards built to WCAG 2.1 AA.
Plan your healthcare dashboards with Agnotic
Work with a healthcare fractional CTO or browse more articles in our Data Engineering hub.
Related reading on Agnotic
Continue with guides on EHR data analytics, healthcare data management, Epic Clarity reporting data and clinical data integration.
Sources
- 45 CFR 164.506: Uses and disclosures for treatment, payment and health care operations
- HHS: Minimum Necessary Requirement
- HHS: Guidance Regarding Methods for De-identification of PHI
- ResDAC: CMS Cell Size Suppression Policy
- Federal Register: Section 504 web and mobile accessibility compliance date extension (11 May 2026)
- W3C: Web Content Accessibility Guidelines (WCAG) 2.1
- HL7: FHIR Bulk Data Access Implementation Guide
- 45 CFR 92.210: Nondiscrimination in the use of patient care decision support tools