

Central monitors
Watch signals across all sites in a study and decide which ones need a closer look.
- Sites ranked against their peers
- Open signals with their age
- One click from a signal to the data behind it


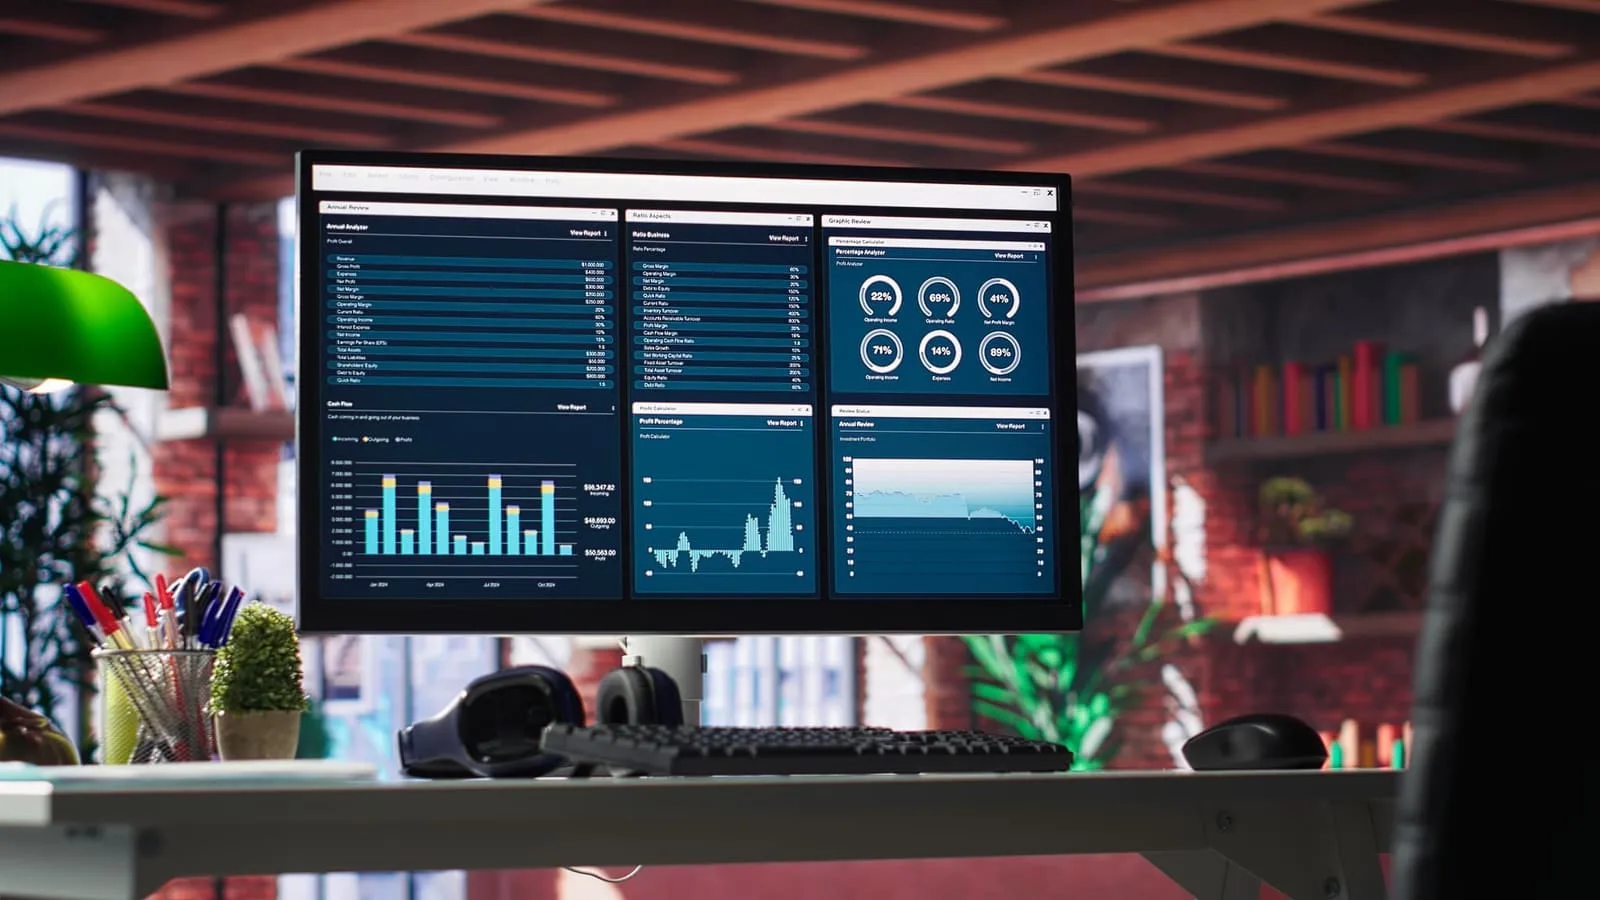
A contract research organization runs many studies for many sponsors, and every sponsor wants the same thing: early warning when a site starts to drift. Agnotic Technologies builds the analytics behind risk-based and central monitoring, from the cross-study data model to the sponsor view, with thresholds your study teams own.
Trusted by global innovators






CRO analytics for risk-based monitoring is software that pulls data from CTMS, EDC, IRT and eTMF into one model, calculates key risk indicators for every site, tracks quality tolerance limits for each trial and shows every sponsor only its own studies. Agnotic Technologies builds this layer for contract research organizations, while the thresholds stay with the study team.
One data model, four audiences. Each view answers a different question, and each one is limited to the studies that person is allowed to see.
Watch signals across all sites in a study and decide which ones need a closer look.
Turn signals into targeted visits, calls and retraining.
See the status of their own studies without asking for an export.
Compare operations across studies that use the same indicator library.
Most misses come from the data around the indicator, not from the indicator itself.
Stale inputs: indicators run on data entered weeks after the visit, so the signal appears after the damage is done.
Different definitions per study: one team counts query age from opening, another from the last response, so the portfolio view cannot be compared.
Thresholds in spreadsheets: nobody can show which limit applied on the day a site was reviewed.
Sites compared only with themselves: a site that has always under-reported adverse events looks stable.
Signals without a record: a breach is discussed in a meeting, but the evaluation and the action are not written down anywhere the sponsor can see.
Sponsor data in one pool: studies for different sponsors share tables, and every new report risks showing one sponsor another's data.
Three choices made early keep the analytics comparable, explainable and safe to share.
A shared indicator library holds the formula and source fields. Each study sets its own parameters and thresholds in the risk assessment, so portfolio views stay comparable.
Central monitoring looks for sites that differ from the rest of the study, not just sites that cross a fixed line. A person reviews every flagged site before anything happens.
Each signal moves from raised to reviewed to actioned to closed, with names and dates. That record is what the sponsor, and an inspector, will ask for.
Modules we build or integrate, sized to your portfolio and the systems you already run.
Indicator formulas defined once, with study parameters and thresholds versioned by effective date.
Trial-level limits from the risk assessment, current values and the evaluation recorded for every breach.
Site distributions for adverse event rates, entry lag and query rates, with outlier sites highlighted for review.
Every signal with its owner, evaluation, action and closure, linked to the data that raised it.
Visit and call lists built from open signals, so CRAs go where the risk is.
Dashboards and issue logs per sponsor tenant, with access limited to that sponsor's studies.
Enrolment, query backlog and monitoring workload across studies on the shared library.
Every number traced back to the source system, extract and mapping version it came from.
The path we build for each study. Every step keeps the sponsor and study identifiers, so separation holds from source to screen.
Sites and visits from CTMS, data and queries from EDC, randomization and dispensing from IRT, document status from eTMF.
Study, site, participant, visit, query, adverse event and deviation, with study-specific mappings kept under version control.
On the schedule agreed with the study team, using the parameters in force on that date.
Fixed limits and peer comparisons both run, and each result keeps the rule that produced it.
The central monitor reviews each signal and decides whether it needs action.
Decision, action, owner and due date are saved against the signal.
The sponsor's tenant shows its studies, QTL status and open issues.
Chosen to fit the study systems you already license and the sponsors you report to.
Each indicator, the system it comes from, what it can point to and what a breach should start. Thresholds come from the study team's risk assessment; we build the calculation and the routing, not the numbers.
| Indicator | Source system | What it can point to | What a breach starts |
|---|---|---|---|
| Screen failure rate per site | CTMS or EDC screening log | Eligibility criteria misread, or recruitment from the wrong population | Central monitor review, then eligibility retraining for the site |
| Data entry lag (visit date to eCRF entry) | EDC audit trail and CTMS visit dates | Site staffing gaps, data entered from memory | Call with the site coordinator, then a targeted visit if it persists |
| Open query age | EDC query records | Unresolved data issues that will block database lock | Escalation to the CRA and the data management lead |
| Adverse event rate against peer sites | EDC adverse event forms | Possible under-reporting of adverse events | Medical monitor review and targeted source data review |
| Protocol deviations per participant | CTMS or deviation log | Procedures not followed as written | Root cause review, and escalation to the sponsor when a QTL is affected |
| Dispensing mismatches | IRT | Kit given to the wrong participant or arm | Immediate review with the unblinded team |
| Essential document gaps | eTMF | Missing or expired site documents | CRA follow-up before the next visit |
Measures about the analytics itself, reviewed with your clinical operations leads.
Time from a source update to the refreshed indicator.
Signals with a recorded evaluation and action, by study.
Studies and sites using the common indicator definitions.
Monitoring visits triggered by signals against calendar visits.
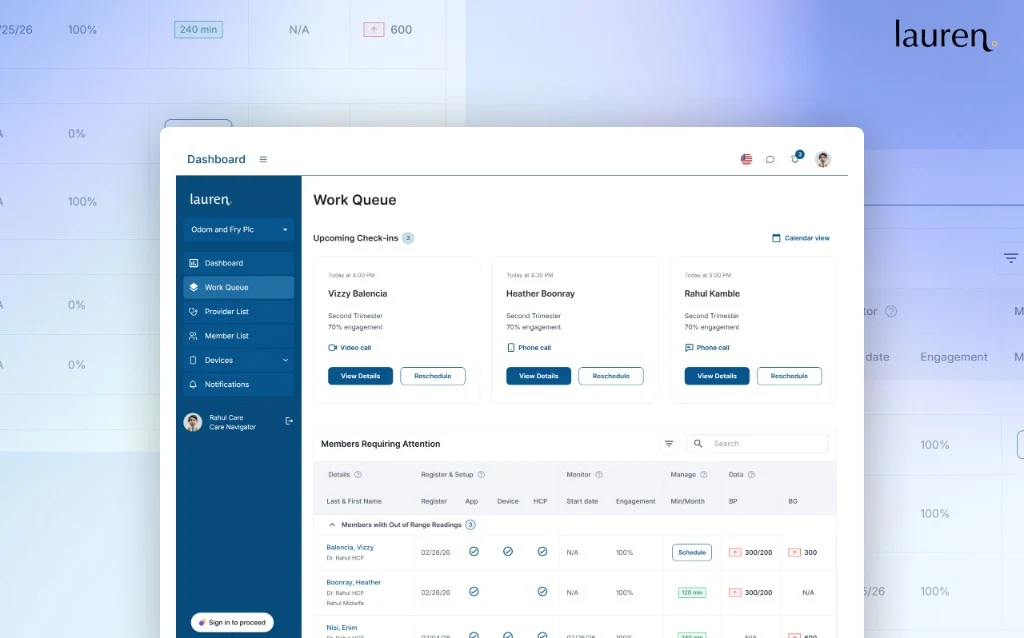
A HIPAA-ready maternal health platform enabling remote patient monitoring, care coordination, and personalized engagement from pre-pregnancy through postpartum.
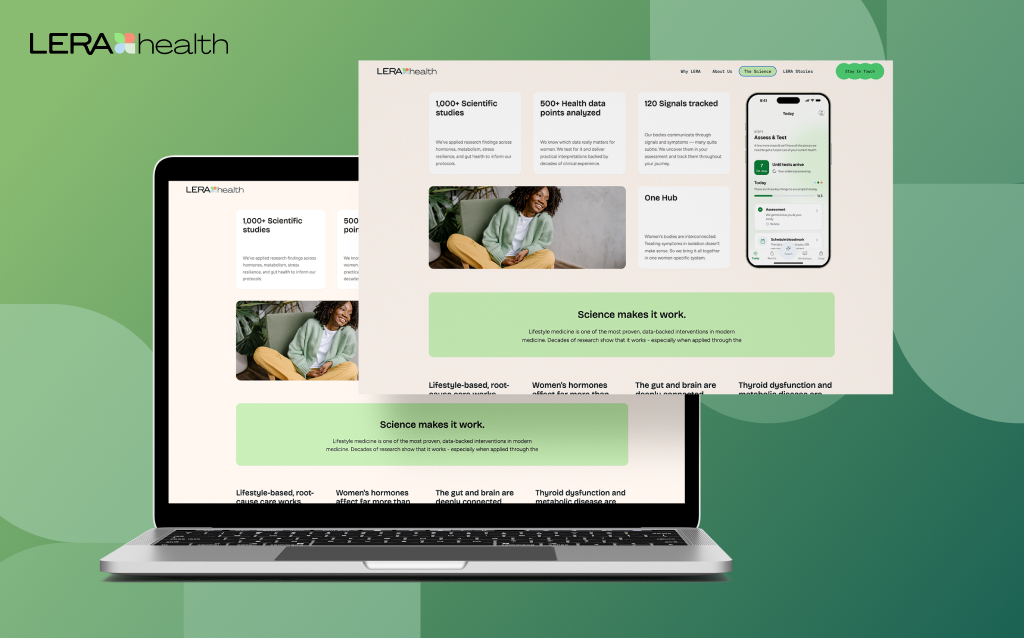
A women’s health product experience focused on guided care journeys, education, and compliance-aware workflows to support long-term engagement.
Teams that have outgrown spreadsheets and vendor exports.
One indicator library across a growing portfolio of studies.
Central monitoring offered as a service line to several sponsors.
Indicators tuned to oncology, rare disease or device studies.
Peer comparison and signal logs instead of manual listings.
Sponsor dashboards without emailing exports every week.
Statistical monitoring code moved from one-off scripts into a governed pipeline.
The systems CRO monitoring analytics reads from and reports to.
We build secure, scalable products designed for privacy, interoperability, and regulatory readiness from day one across every sector we serve.

Protect PHI with privacy-first architecture, encrypted storage and transmission, and strict access controls.

Implement lawful consent flows, data minimization, and secure processing for global data privacy.
We combine deep technical expertise with industry-specific knowledge to deliver solutions that aren't just functional, but transformational.
We implement rigorous security protocols and compliance standards (HIPAA, GDPR, SOC2) across all industrial solutions to protect sensitive data.
Our architectures are built to handle massive data loads and user bases, keeping performance steady whether you're serving ten or ten million.
Using our suite of internal tools and proven frameworks, we cut setup work so your first release reaches users sooner.
Beyond simple wrappers, we build deep-learning integrations and predictive analytics directly into the core of your industry-specific workflows.
We start with one study and grow to the portfolio. Timing depends on scope; we agree a fixed first release on the scoping call.
We review your study systems, sponsor reporting duties and the indicators you track today.
Your clinical operations and biostatistics leads agree the shared library and how studies set thresholds.
Extracts, the data model, indicators, signal routing and the sponsor view working for a single study.
More studies and sponsors onto the same model, with mappings versioned per study.
New indicators and new study systems added through your change process.
Short facts we design the indicators, records and sponsor separation around, each linked to its primary source.
ICH E6(R3), adopted on 6 January 2025, says the sponsor should set pre-specified acceptable ranges, such as quality tolerance limits at the trial level, and evaluate any deviation beyond them for a possible systemic issue.
Source: ICH E6(R3) Good Clinical Practice, section 3.10.1.3ICH E6(R3) describes centralised monitoring as a timely evaluation of accumulated data by qualified people, and says centralised data analytics can help identify systemic or site-specific issues, including protocol noncompliance and potentially unreliable data.
Source: ICH E6(R3) Good Clinical Practice, section 3.11.4.2A sponsor may transfer any or all of its IND obligations to a contract research organization, the transfer must be described in writing, and any obligation not covered by the written description is deemed not to have been transferred.
Source: 21 CFR 312.52(a) (eCFR)A contract research organization that assumes a sponsor obligation must comply with the regulations that apply to it and is subject to the same regulatory action as a sponsor for failing to comply.
Source: 21 CFR 312.52(b) (eCFR)FDA's final guidance A Risk-Based Approach to Monitoring of Clinical Investigations (April 2023) calls monitoring a quality control tool for determining whether investigation activities are carried out as planned, and covers the monitoring plan and how results are addressed and communicated.
Source: FDA guidance, April 2023We don't just build products; we forge lasting partnerships. See how we've helped industry leaders transform their vision into technical reality.
“I can clearly see how Agnotic has a unique way of handling end-to-end development. They are always active on quick chat and provide support quickly.”

Aaron Phelan
Founder, Benchmark
“Agnotic combines deep technical expertise with strong domain knowledge. They understand the business context, anticipate challenges, and make collaboration smooth and effective.”

John Pasmore
Founder, Latimer
“Agnotic is the best technical team we evaluated. Their engineering excellence made our work dramatically easier and allowed us to stay focused on what matters most for maternal care outcomes. They took full ownership of the technical execution, and we are always happy to continue working together.”

Kim Smith
Founder, My Lauren
This page covers monitoring analytics across studies. These pages cover the study systems it reads from.
eCRF design, edit checks and database lock for a single study.
CTMS features for sites, visits and study operations.
Trial master file structure, document workflow and inspection readiness.
Software for sponsors, CROs and research teams.
What drives the data a study generates, and the platform we build to hold it.
Explore other production-grade engineering platforms we deliver across healthcare.
The technical patterns behind this platform translate naturally into adjacent verticals.